Introduction
If you have a copy of Visual Studio 2010 Premium or Ultimate, you’ll likely have a menu in your Integrated Development Environment (IDE) called “Analyze”.
Chances are, you might not have investigated the true potential of the profiling tools in VS 2010. This article will demonstrate usage of some of the profiling techniques, and then discuss how to interpret and act on the results.
You’ll need:
- A copy of Visual Studio 2010 Premium or Ultimate
- A .NET solution for testing purposes, the more complex the better
- Preferably a WinForms or Console application, but a WCF service application or ASP.net website will work just fine
- Memory (at least 4 GB) and a decent CPU
Profiling is an expensive operation in terms of system resources. Trying to profile a .NET application on a slow, low memory machine is going to be a long and frustrating task, so choose and configure your environment well!
My Environment
At the moment, I’ve configured two independent environments – a desktop machine, and a Hyper-V virtual client OS, specifications are as below.
Desktop
- Windows 7 x64 + Service Pack 1
- Intel Core i5 2400 3.10 GHz (dual core with hyper-threading)
- 4.0 GB Memory
- 222 GB HDD (120 GB Free)
Hyper-V Server Client OS
- Windows Server 2008 R2 x64+ Service Pack 1
- AMD Opteron (Dual Core) 2216 HE 1.58 GHz
- 6.0 GB Memory
- 60 GB HDD (20 GB free)
Prerequisites/Considerations
Profiling is not an inexpensive operation. You will require a decent amount of hard drive space (so that Visual Studio can record profiling information as you run your tests) and plenty of memory. Remember, most of the time the focus should be on determining what your application or services does, not so much why it labours when in a resource constrained environment.
I’m not saying that there’s no value in profiling under a resource constrained environment – there likely is – however it will be a terribly frustrating endeavour and it will be hard to differentiate between overhead from running your application or service, and the overhead of the act of profiling itself. You can likely extrapolate the impact of low resource environments based on the metrics collected during profiling anyway.
In short: the better the environment you profile under, the more likely the data is of use to you. Just keep it in mind.
In my more recent experience, I found that a memory profile session used almost 8 GB of hard drive space to track/record an application which had a memory footprint of between 500mb to 650 mb. I’m not sure if this is much of a guide. The more HDD space the better is a good general rule.
Method
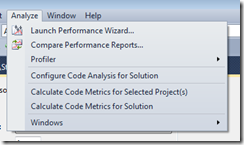
Open your solution in Visual Studio, for best results, I’d recommend profiling in Debug configuration and preferably according to the processor architecture of your machine (i.e. x64 if your machine is 64 bit). Ensure your solution successfully compiles – always helps – and you should be ready to proceed. Note – if you are using a processor specific configuration, all modules to be profiled must match (no mix ‘n match of 32 and 64 bit modules). Assuming you have Visual Studio 2010 Premium or Ultimate, you should have an “Analyze” menu:
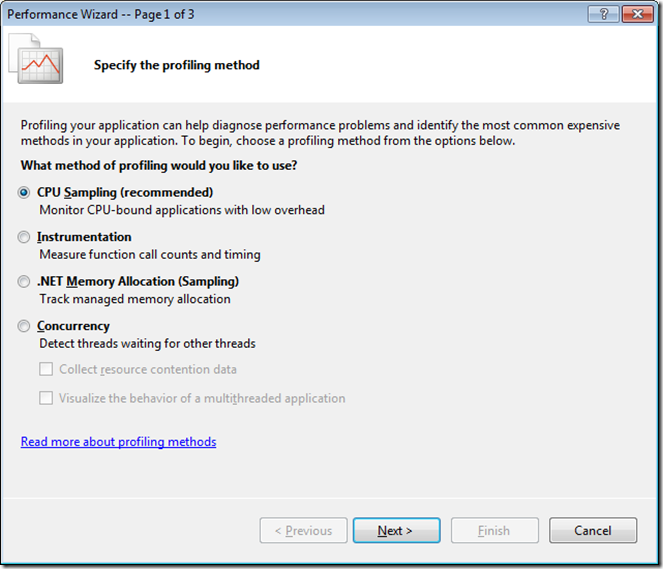
The best way to proceed, the first time, is to “Launch Performance Wizard”:
There are quite a few decent options here, but what do they cover? Here’s a more in depth look at each configuration:
| Method | Description |
| Sampling | Collects statistical data about the work performed by an application. |
| Instrumentation | Collects detailed timing information about each function call. |
| Concurrency | Collects detailed information about multi-threaded applications. |
| .NET memory | Collects detailed information about .NET memory allocation and garbage collection. |
| Tier interaction | Collects information about synchronous ADO.NET function calls to a SqlServer database. |
For this and the next article in this series, I’m mostly going to focus on the more useful profiling methods – .NET Memory and Instrumentation, but concurrency, tier interaction and sampling all have their uses.
What is useful in understanding up front, is that no matter what your method of data collection (profiling) is, the template within which the profile reports are rendered remains more or less the same. The varying factor is the X-factor – i.e. the “what is collected”. Memory is pretty obvious – the focus of sampling is on the allocation (exclusive and inclusive) of memory and the performance of Garbage Collection. With instrumentation, the sampling focus is on call frequency, call chaining, call durations and the distribution of call frequency between functions and modules.
The more information that can be supplied (i.e. symbols, debugging info such as .pdbs and line numbers/source code) the better when it comes to exhaustive analysis.
Some Notes on Running the Profiler
You will almost invariably need to run Visual Studio 2010 with elevated permissions. This (some days) seems like a universal constant as we start to require a heavier hand in constructing, tuning and testing our software. For the best results, the more control and permissions you have (administration rights help the profiler collect performance counter stats information, for example) the better. Some profiling (such as concurrency) may require changes to the system configuration (and may require a system reboot).
In the next article…
That’s it for our introductory article – the next article will dive into the actually profiling itself, and how to interpret the results. Stay tuned for more.
Further Reading
Compare Editions of Visual Studio 2010
Understanding Profiling Methods
User Permissions Required to Profile (applies to Vista, but should apply equally to Windows 7 and Server 2008)


